
Diagnostics
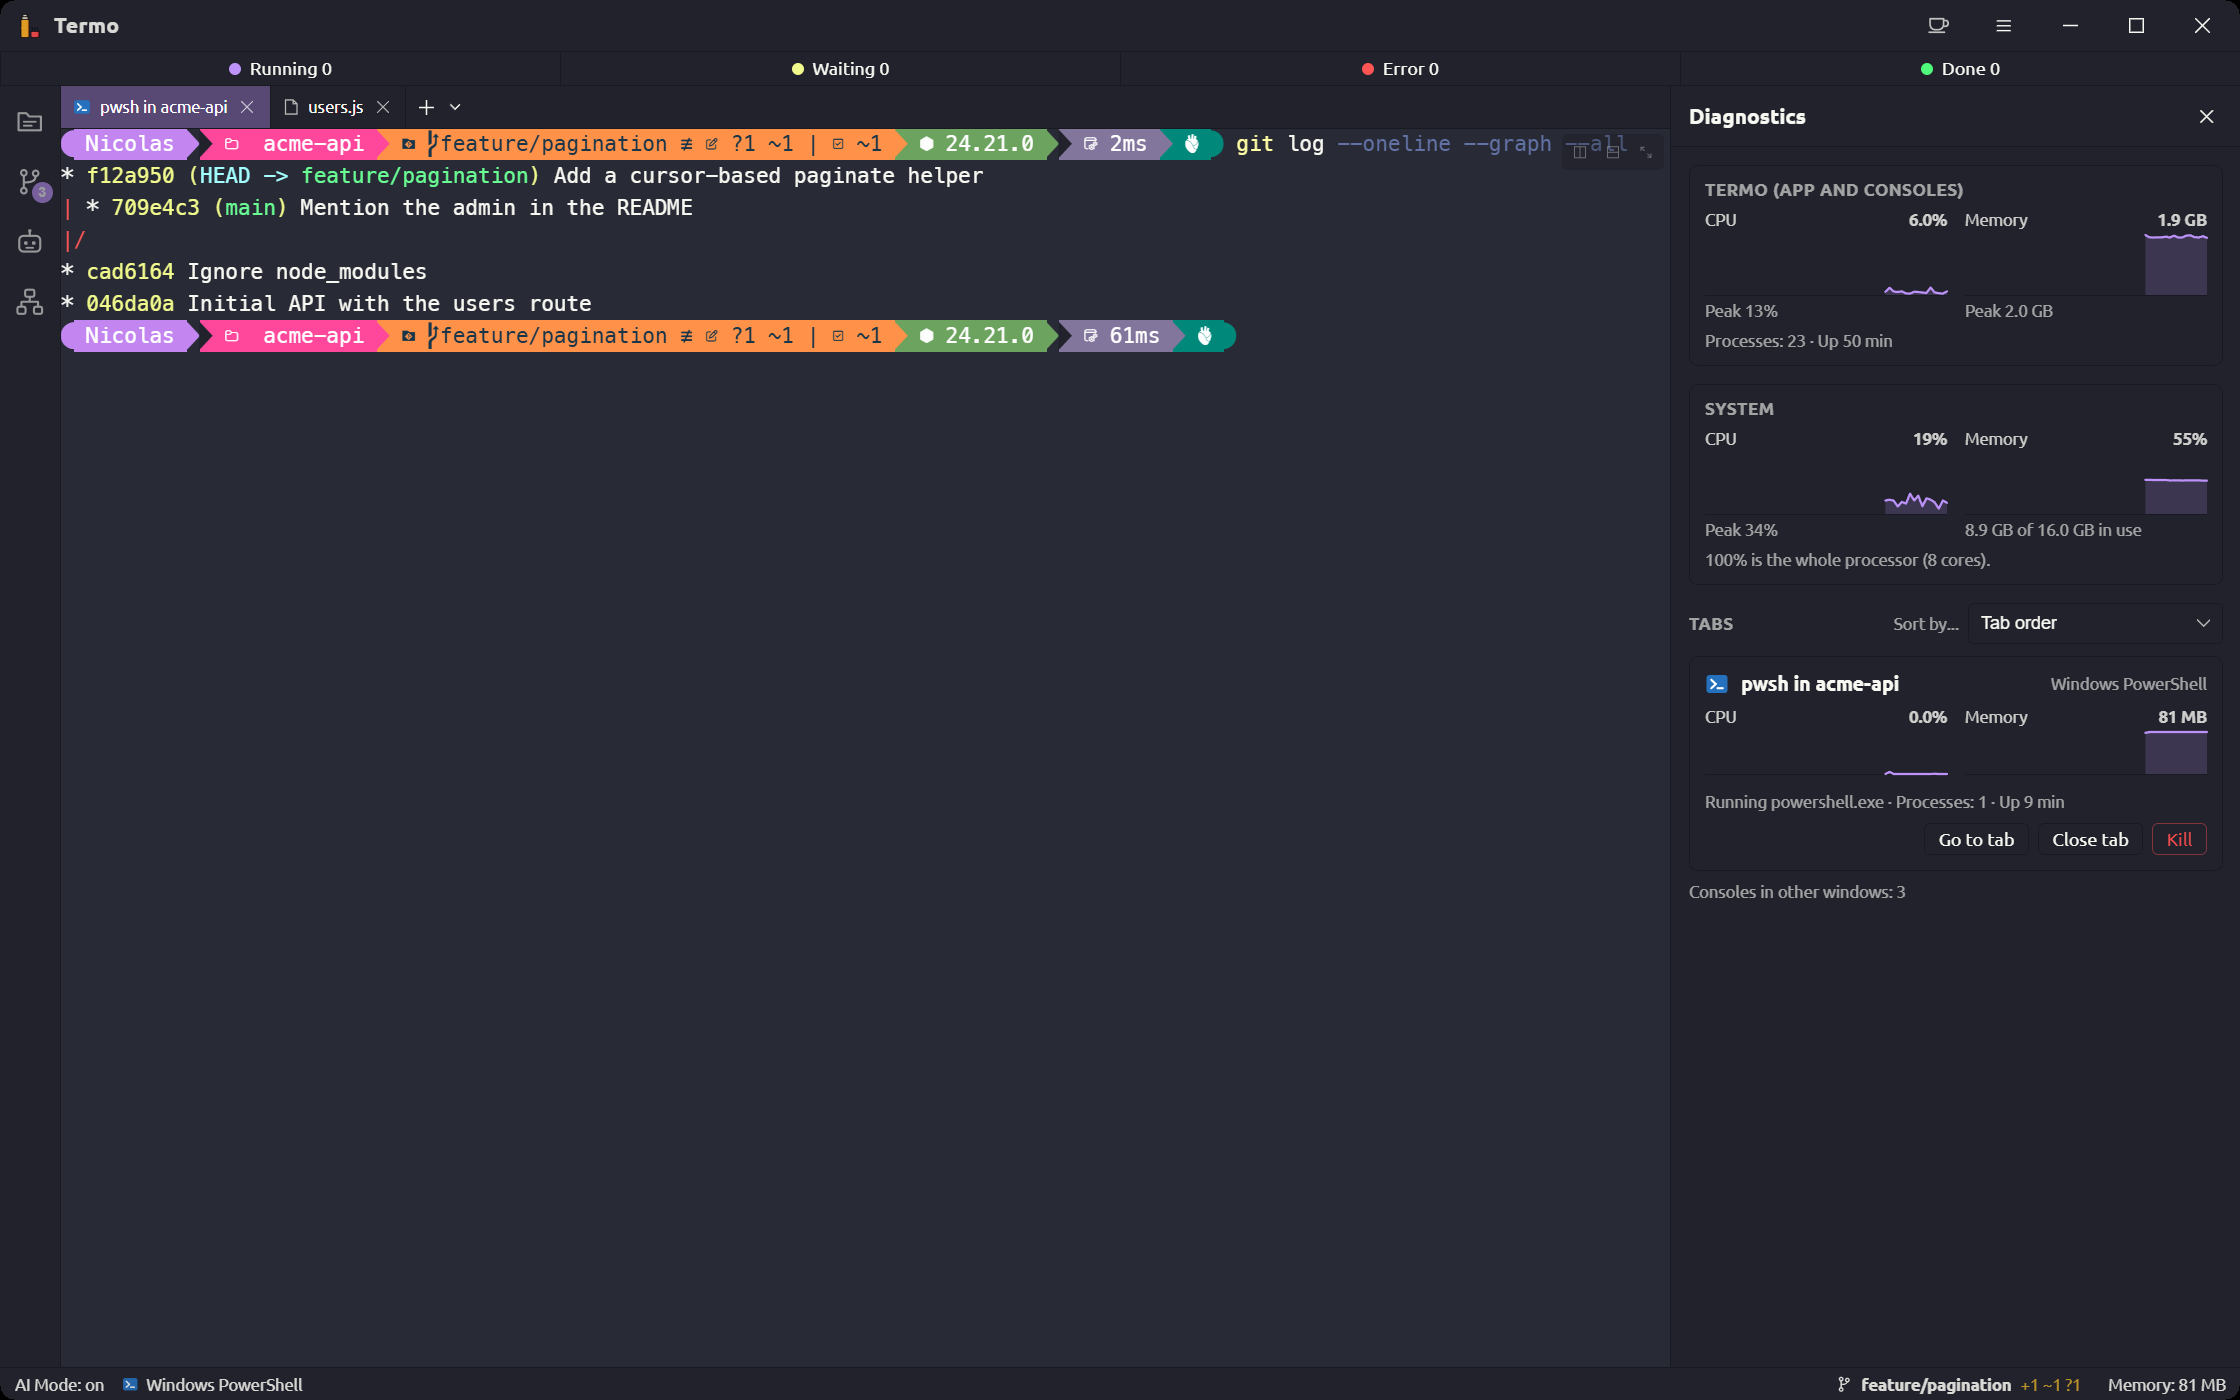
The diagnostics panel shows how much CPU and memory Termo and each of your tabs use. It helps you find which process is slowing the machine down.
Open the panel
Press Ctrl+Shift+D (⌘⇧D on macOS), or open the ≡ menu → Diagnostics...
What it shows
At the top, the usage of Termo (app and consoles) and of the System:
- CPU, last minute and Memory, last minute, with the value now and the peak.
- For CPU, 100% is the whole processor, with all its cores.
- The system's memory, in use out of the total.
Below, one row per tab with:
- how many processes it has,
- how long it has been up,
- which program it is running,
- its CPU and memory.
A tab that uses a lot is marked High usage.
Sort the tabs
Sort by... changes the order: the tabs' own, or by CPU or memory, high to low or the other way.
Act on a tab
| Action | What it does |
|---|---|
| Go to tab | Moves the focus to that tab |
| Close tab | Closes the tab |
| Kill | Kills the tab's processes and closes it, after you confirm |
If it is the only tab, it cannot be closed: Kill ends its processes and leaves it open.
If you have more Termo windows, the panel says how many consoles are in the others.
Memory on the status bar
Without opening the panel, the status bar shows on the right the memory used by the active console and the processes running in it.